Room Addition Cost [2026 Data]
Adding a room to your house costs approximately $48,000 on average in 2026, with many homeowners spending between $20,900 and $72,600. Larger additions, bathrooms, and primary suites can cost considerably




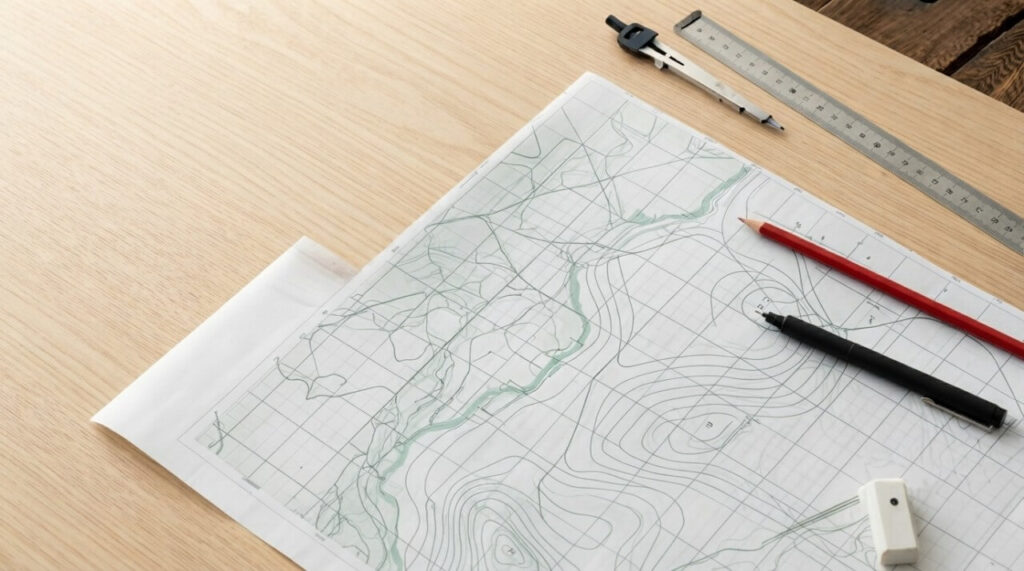

A topographic site plan shows how land rises, falls, drains, and changes across a property. The main clues are contour lines, spot elevations, slope direction, grade breaks, ridges, valleys, depressions, and drainage features.
Once you know those patterns, you can quickly see whether a proposed house, driveway, retaining wall, pool, or addition sits on relatively level ground or has to deal with a meaningful elevation change.
At Get a Site Plan, we prepare non-certified site plans online using available GIS data, satellite imagery, public property records, existing drawings, and owner-supplied information. Topographic contour lines can be added when suitable GIS elevation data is available.
Our drawings are not legal or field topographic surveys and do not replace a licensed surveyor, civil engineer, architect, or other professional when one is required.
The authority having jurisdiction (AHJ) decides what elevations, certifications, grading design, drainage calculations, and permits your project needs. We do not issue permits or determine zoning compliance.
| Feature | What it looks like | What it tells you |
| Gentle slope | Contours spaced far apart | Elevation changes gradually |
| Steep slope | Contours close together | Elevation changes quickly |
| Hill | Closed contours increasing inward | Ground rises toward the center |
| Depression | Closed contours with hachures or lower values inward | Ground falls toward the center |
| Valley or swale | V- or U-shaped contours pointing uphill | Low ground may collect or carry water |
| Ridge | Contours bending around projecting high ground | Land falls away on either side |
| Grade break | Sudden change in contour spacing | Slope becomes steeper or flatter |
The easiest way to read these patterns is to check elevation numbers first, spacing second, and shape third.
The same handful of contour patterns appear again and again on residential property drawings.
Imagine contour lines labeled 100, 102, 104, 106, and 108 feet spread across most of a backyard. The contour interval is 2 feet, meaning each line represents another 2 feet of vertical elevation.
Because the lines are widely spaced, the ground gains elevation gradually.
USGS uses the same reading principle: closely spaced contours indicate steeper terrain, while widely spaced contours indicate more level or gently sloping land.
For a homeowner, a gentle slope can matter when positioning an addition, patio, driveway, shed, pool, or detached garage. The contours show how the project relates to the ground, although they do not by themselves determine whether grading or drainage work is necessary.
Now place those same 2-foot elevation intervals inside a much narrower part of the lot.
The vertical difference between each line has not changed. The horizontal distance has.
That means the slope is steeper.

A proposed structure can therefore sit only 20 feet from another feature horizontally while being several feet higher or lower. A satellite image may make the area look relatively straightforward even when the contour lines reveal substantial grade change.
Steeper sites often require closer attention to foundations, retaining walls, erosion, driveway access, drainage, and grading.
Local requirements can also become more detailed. Austin, for example, requires natural topography at two-foot intervals on certain site plans and calls for spot elevations when the site has less than a 2% slope, according to its site plan requirements.
Closed contour lines usually represent a hill when the elevation values increase toward the center.
Suppose the outside contour reads 120 feet. Moving inward, you see 122, 124, and 126 feet.
The center is higher than the surrounding land.
A relatively small rise can influence where surface water travels, how a driveway reaches a garage, how much foundation is exposed, and how a proposed structure relates to the surrounding grade.
Read the elevation labels before deciding what a closed contour represents. Closed shapes can also identify low areas.
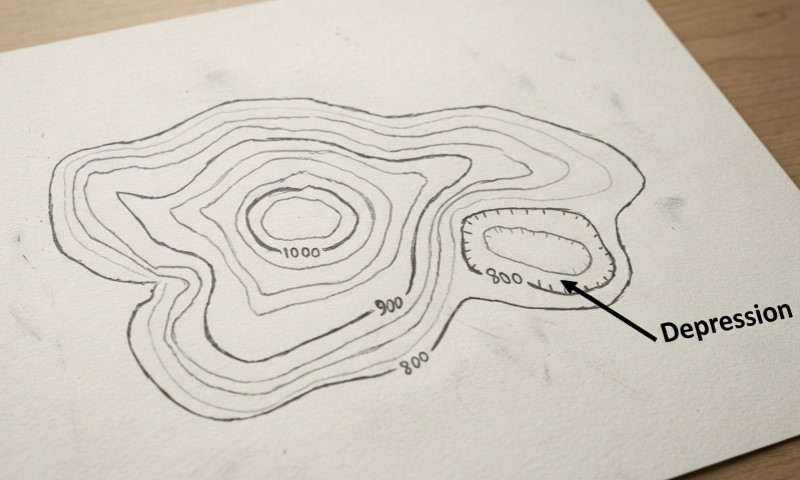
A depression is an enclosed area that sits below the surrounding ground.
Standard USGS topographic mapping uses contour lines with short marks called hachures for depressions. The marks point toward lower elevation.
On a residential site plan, a depression should make you look for other information nearby: spot elevations, drainage arrows, swales, catch basins, or another indication of where surface water will go.
A depression on a contour drawing does not automatically mean the property is in a regulatory floodplain. FEMA’s Flood Map Service Center is the official public source for National Flood Insurance Program flood-hazard mapping, and local floodplain requirements can add another layer of review.
When contours cross a narrow valley, drainage path, or swale, they often form a V or U.
The pointed end generally faces uphill or upstream.
That makes the pattern particularly useful because it helps identify both the low ground and the direction from which water may approach.
A residential swale might run along a side yard, behind a retaining wall, between two properties, or across the rear portion of a lot. Adding pavement, a garage, an addition, or another structure can change how runoff reaches that area.
Our collection of site plan examples includes grading, driveway, retaining-wall, and other situations where elevations and water movement can become important parts of the drawing.
A ridge is elongated high ground with lower terrain on either side.
Its contour pattern can initially resemble a valley, which is why you should check the elevation numbers instead of identifying the feature from shape alone.
If elevations rise as you move toward the centerline and decrease again on the opposite side, you are crossing a ridge.
Surface runoff generally moves away from the higher ground toward lower areas on either side. On residential property, that relationship can affect driveways, roof drainage, landscaping, building placement, and neighboring lots.
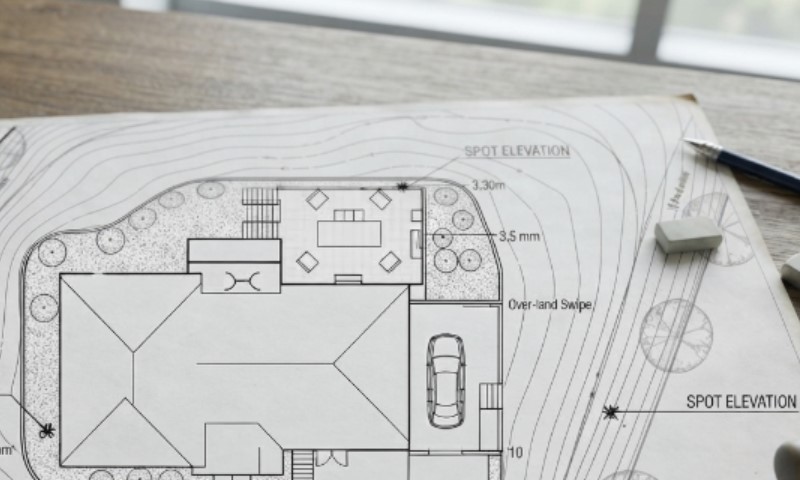
Contour lines describe a landform continuously. Spot elevations identify the elevation at a particular location.
They commonly appear at building corners, property corners, driveway edges, garage thresholds, drainage inlets, grade breaks, and the tops or bottoms of retaining walls.
For example:
Garage slab: 103.5 ft
Driveway point: 101.0 ft
Those two referenced points have a vertical difference of 2.5 feet.
Portland’s residential permitting guidance requires elevations at property and building corners in certain situations and distinguishes between existing and finished grades on uneven properties.
Topography describes the three-dimensional shape of land on a two-dimensional drawing. The U.S. Geological Survey explains that contour lines connect points at the same elevation. On a site plan, those lines reveal where ground is high, low, steep, gentle, or changing direction.
Topographic information may include contour lines, elevation labels, spot elevations, existing and proposed grades, drainage arrows, swales, retaining-wall elevations, and finished-floor elevations.
Not every site plan needs all of those details. A relatively simple property drawing may require no contours, while a hillside, retaining-wall, drainage, or grading project can require much more elevation information.
If the rest of the drawing is unfamiliar, our guide to reading a site plan covers property lines, structures, setbacks, waterways, scale, orientation, and other features commonly shown alongside topography.
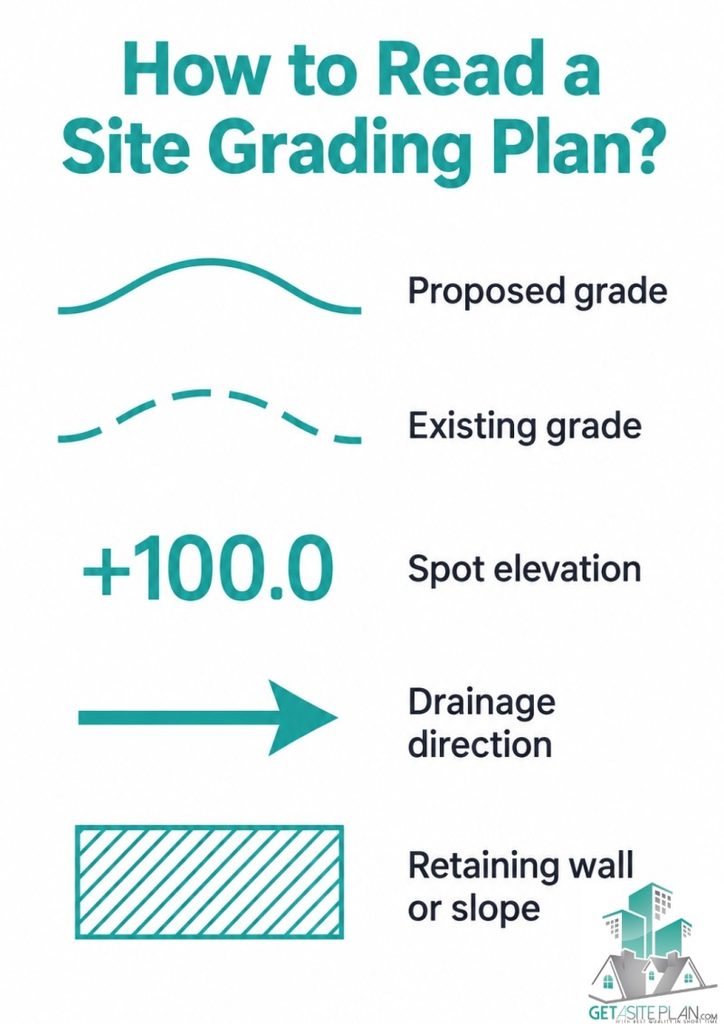
One of the most important distinctions on a grading-related site plan is existing grade versus proposed grade.
Existing grade represents the ground before construction. Proposed or finished grade represents how that ground is intended to look after excavation, fill, construction, or landscaping.
A drawing may use dashed or lighter contours for existing conditions and solid lines for proposed conditions. Drawing conventions vary, so always check the legend.
Compare the two sets of contours around the proposed work.
If an existing contour crosses an area at 104 feet and the proposed surface is shown at 106 feet, fill may be planned there. If the finished elevation is lower than the original terrain, excavation may be involved.
More substantial grading can require cut-and-fill calculations, erosion-control information, drainage design, or drawings prepared and sealed by a licensed engineer. A non-certified site plan does not replace those services.
When two elevations and the horizontal distance between them are known, you can estimate the average slope.
Slope (%) = vertical change ÷ horizontal distance × 100
For example, suppose a driveway rises 4 feet over a horizontal run of 80 feet:
4 ÷ 80 × 100 = 5%
The average slope is 5%.
The same calculation can help you interpret a backyard, proposed walkway, building pad, or other part of the property.
Use it as a plan-reading tool. Projects where exact slope affects drainage, accessibility, structural design, or code compliance may require field measurements and professional calculations.
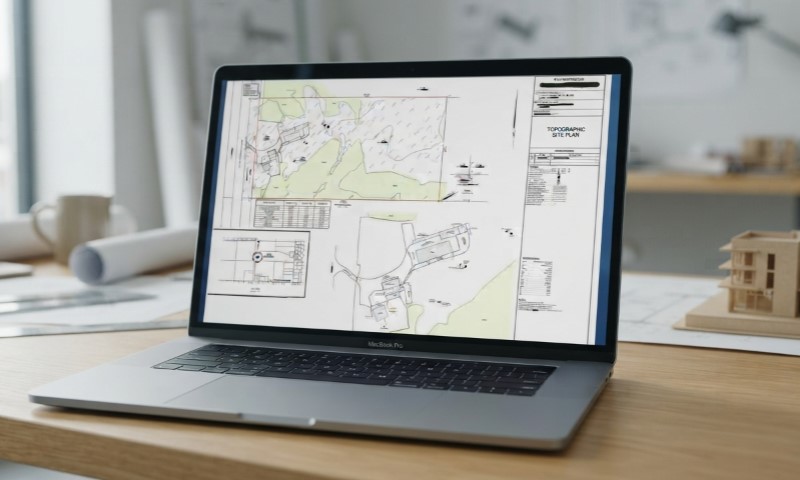
Topography becomes more important whenever construction interacts directly with changing ground elevations.
| Project | Topographic question to check |
| Home addition | Does grade rise or fall across the footprint? |
| Driveway | What is the grade between street and parking area? |
| Retaining wall | What are the elevations above and below it? |
| Pool | Where will surrounding runoff travel? |
| Detached garage | Is its pad above or below the access route? |
| Deck | How does the structure relate to grade below? |
| Drainage work | Where are the high points, swales, and outlets? |
A retaining wall site plan, for example, can show wall alignment, nearby features, top and bottom elevation information where available or supplied, and simple drainage direction.
Structural retaining-wall design, stability calculations, geotechnical work, and engineered drainage remain separate when the AHJ requires them.
The contour interval is the vertical elevation difference between adjacent contour lines.
With a 2-foot interval, the contour following 100 feet is 102 feet. With a 5-foot interval, it would be 105 feet.
Do not assume the interval based on how the drawing looks. USGS notes that contour intervals vary and are identified as part of the map information.
Permit agencies may also specify the detail they expect. Portland’s residential guidance uses contours at 2-foot intervals for certain uneven sites, while some municipalities require comparable contour detail on grading plans.
That variation is why you should check the current AHJ requirements before ordering or submitting a drawing.
The distinction between GIS topography and a field topographic survey is important.
At Get a Site Plan, available GIS and online elevation information can be used to add topographic contour lines to a non-certified plan when appropriate.
That information can help illustrate the general terrain and may be sufficient when the reviewing authority accepts a non-certified drawing.
It does not establish field-verified elevations with survey accuracy.
If your jurisdiction asks for a licensed topographic survey, survey certification, benchmark-based elevations, engineered grading, drainage calculations, or precise construction elevations, you need the appropriate licensed professional.
Property boundaries work the same way. Approximate property lines shown from available records and mapping sources do not establish legal boundaries.
Our guide on how to read a plot plan can help with the other symbols, measurements, property information, access points, and utilities surrounding the topographic information.
An index contour is a thicker contour line labeled with its elevation, making the map easier to read.
No. Standard contour lines represent different elevations, so they do not cross.
BM usually means benchmark, a fixed reference point with a known or assigned elevation.
It is the reference surface from which elevations on the drawing are measured.
It is an extra contour used to show smaller terrain changes that regular contour intervals may miss.
Intermediate contours are often left unlabeled because their elevations can be determined from nearby labeled index contours.
Yes. A project may reference a suitable benchmark outside the lot when it provides the required elevation reference.

Adding a room to your house costs approximately $48,000 on average in 2026, with many homeowners spending between $20,900 and $72,600. Larger additions, bathrooms, and primary suites can cost considerably
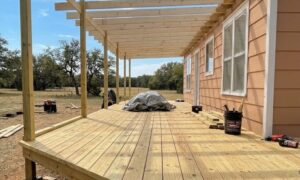
Building a new deck costs $8,321 on average in 2026, with most homeowners spending between $4,339 and $12,653. According to Angi’s 2026 deck cost data, those figures come from more

A general contractor manages the construction side of a project from pre-construction through completion. The job usually includes coordinating subcontractors, ordering materials, managing schedules, handling inspections and permits when required
